
Usecase: data from bezrealitky.cz
Webscraping allows you to obtain data from a website that contains data, but is not and perhaps does not want to be adapted to provide it in aggregate. Real estate websites come to mind as one possible example. For example, the website bezrealitky.cz
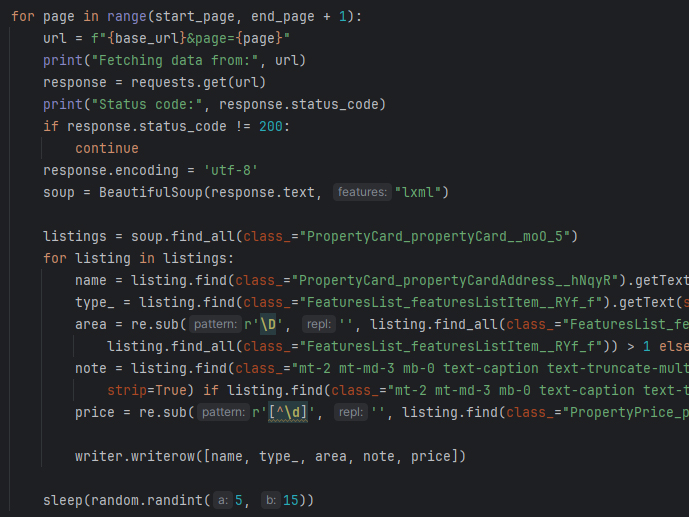
The Python script I used is available on my Github. It should be noted that it will probably not work for very long, as such sites change quite often, so if you want to use it and it doesn't work, you will need to fix it a little.
Now that I have mined the dat using Python, I can analyze it using Python. Here I used Pandas, NumPy, Matplotlib Pyplot, Seaborn, and Stats from SciPy. This webscrape didn't get that many parameters, but it's still an interesting view. The analysis procedure can be found here.
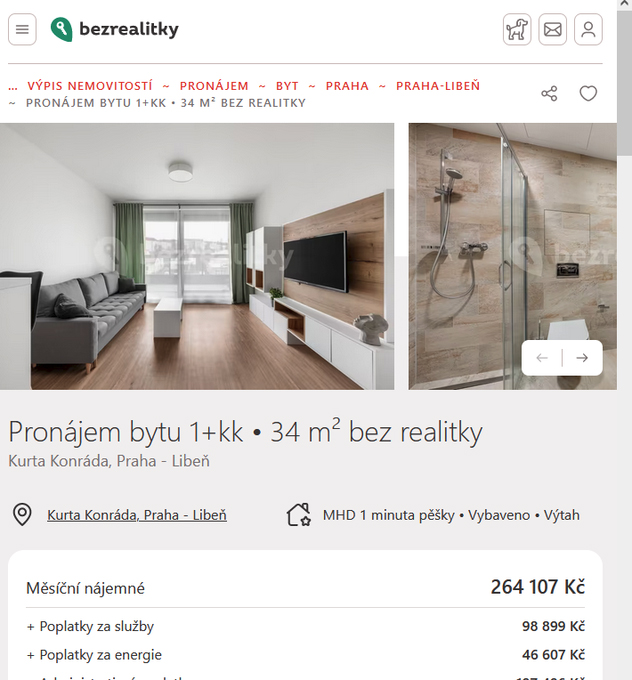
First of all, it is always good to look at outliers. What a crazy amount for a 1+kk in Libeň!
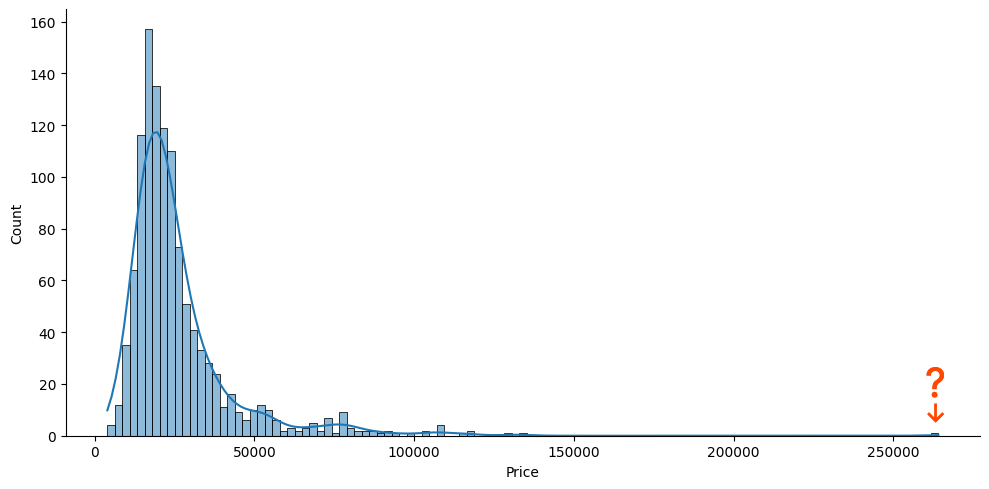
However, it turned out that this ad actually exists at the moment, and there is no choice but to get rid of it as an outlier. How did someone offer something so small in this location for this money? Hard to say, but it just exists and that's not a script issue.
Similarly, the floor area also contains some outliers, which are a gigantic attic loft and one obvious error, evidently 30 and not 300 m².
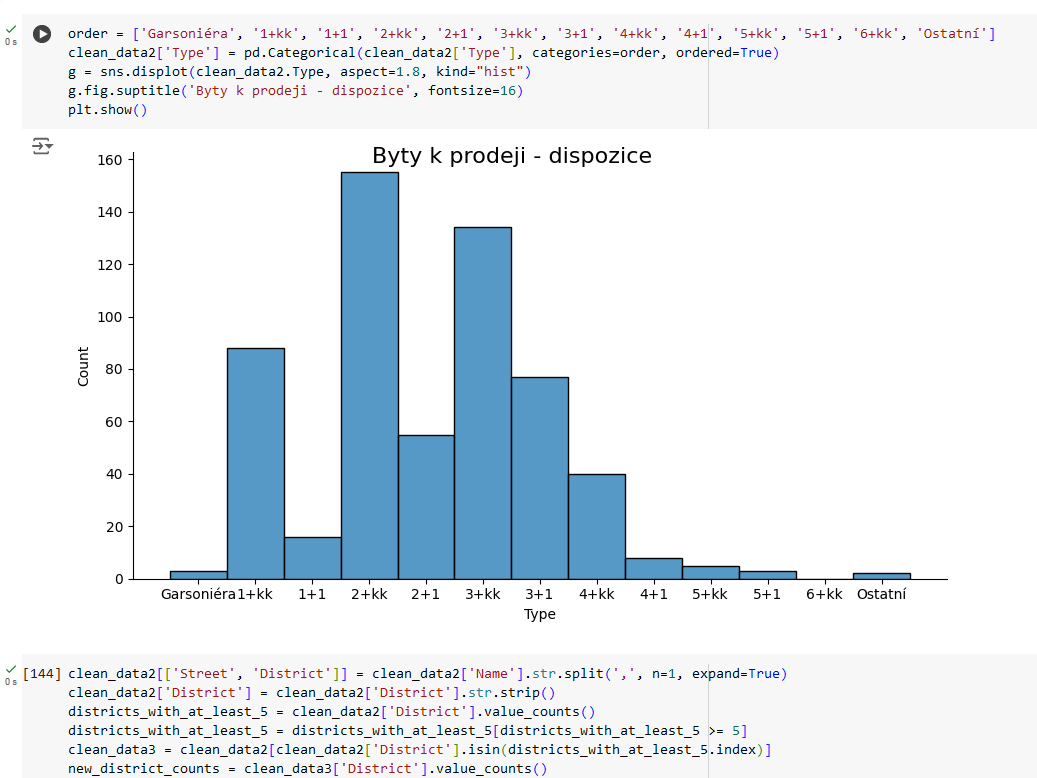
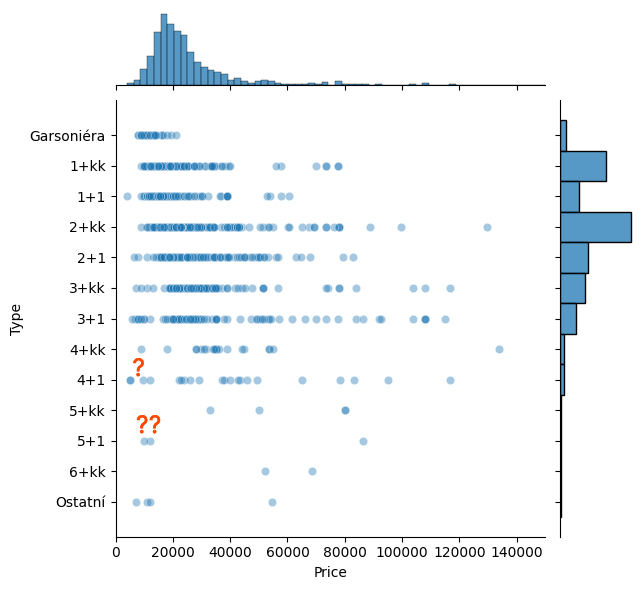
If we take a quick look at how much the layout of the apartments corresponds to the prices, we see more nonsense, this time apartments with a 4+1 or 5+1 layout, for which the stated layout is wrong, or it is actually a room rental in such a large apartment. The data is therefore littered with individual nonsense and for a truly thorough analysis it is good to identify and eliminate it.
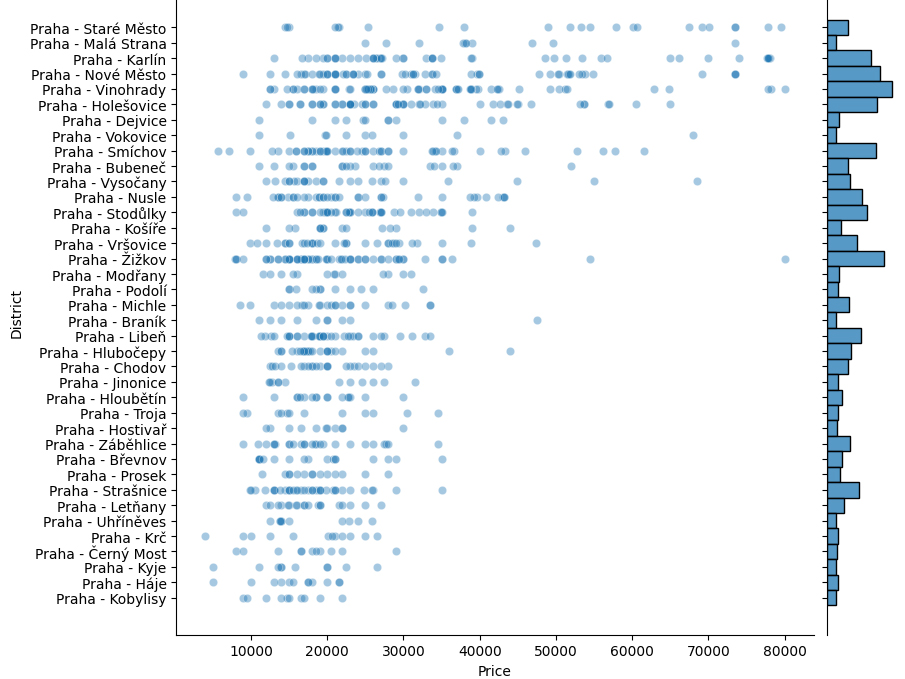
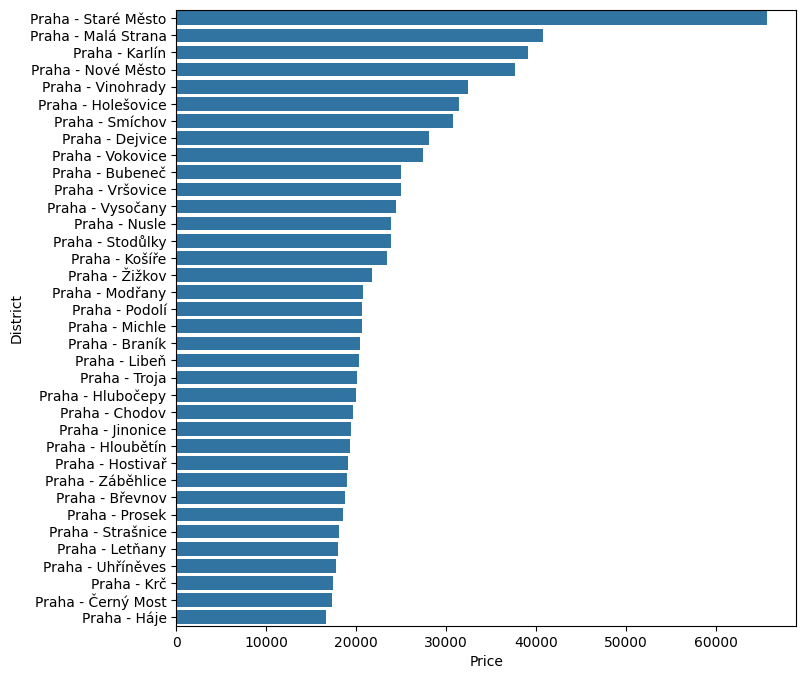
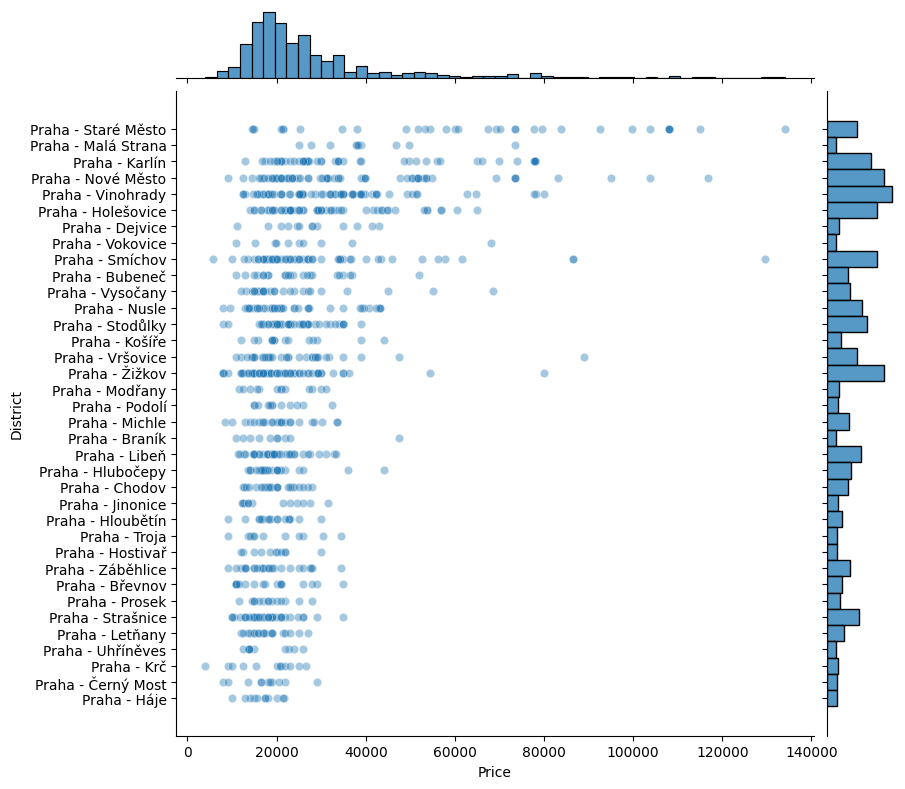
After cleaning, we can continue to deal with what can be read from the data without worrying about working with distorted data, for example how individual Prague districts stand in comparison, both in terms of average price (left) and price distribution (right):
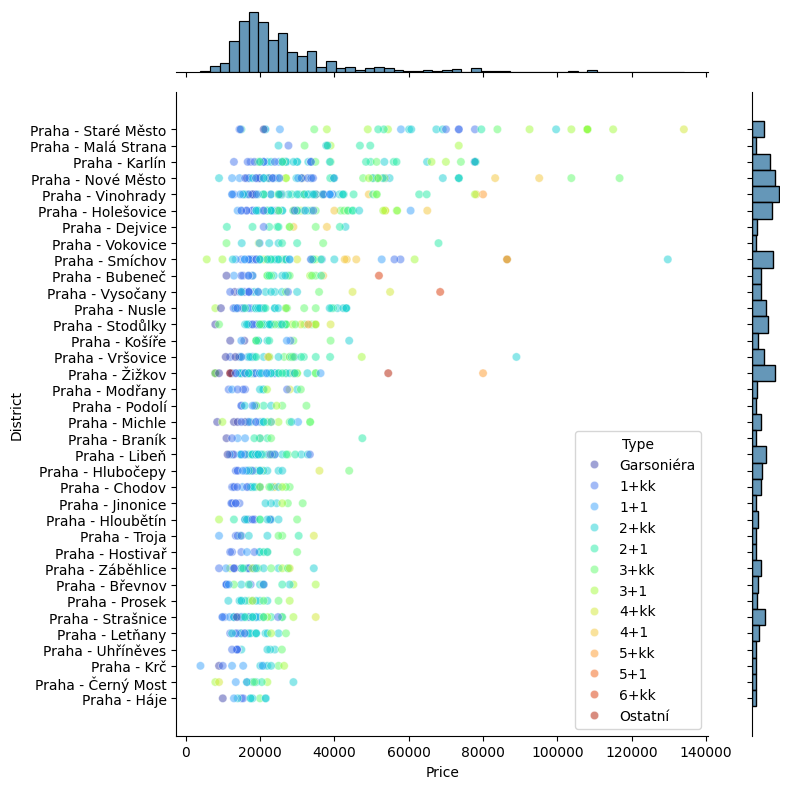
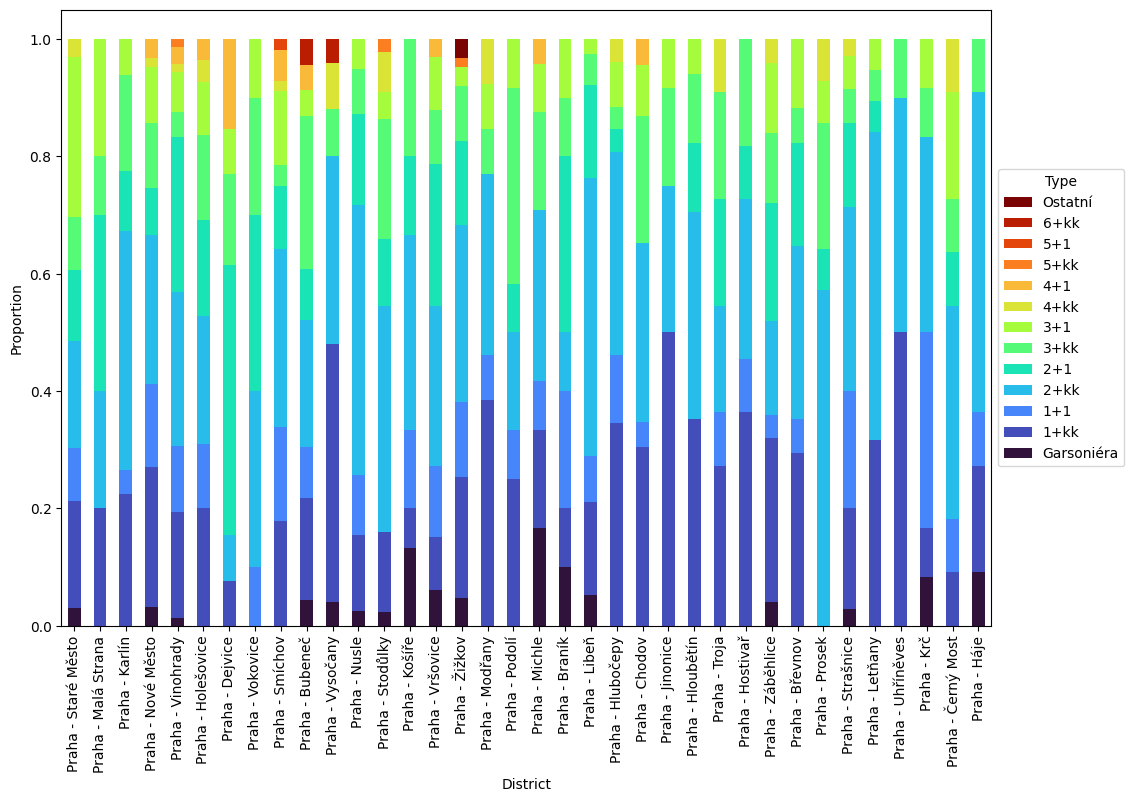
Based on all available variables, we can then draw literally turbo-colored (palette='turbo') graphs from the data, which display information about layouts, location and price, both in the form of distribution (left) and the representation of layouts in individual districts (right):
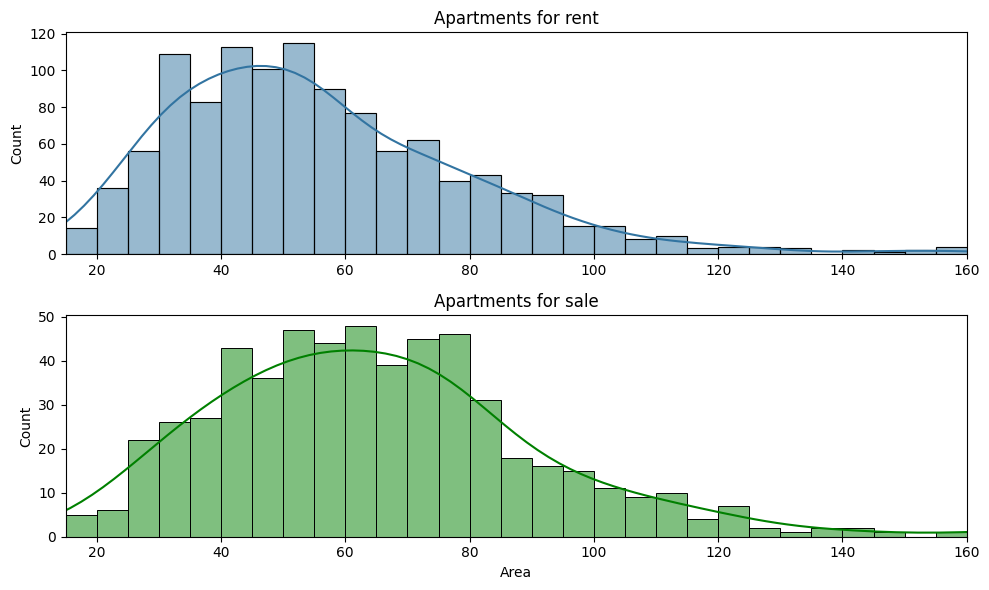
Of course, it is possible to scrape data related to apartments for sale in the same way. Of course, the number of items is different here (in this case by almost half), but that does not prevent us from creating a certain comparison. For example, the floor area of apartments for rent varies visibly in different ratios:
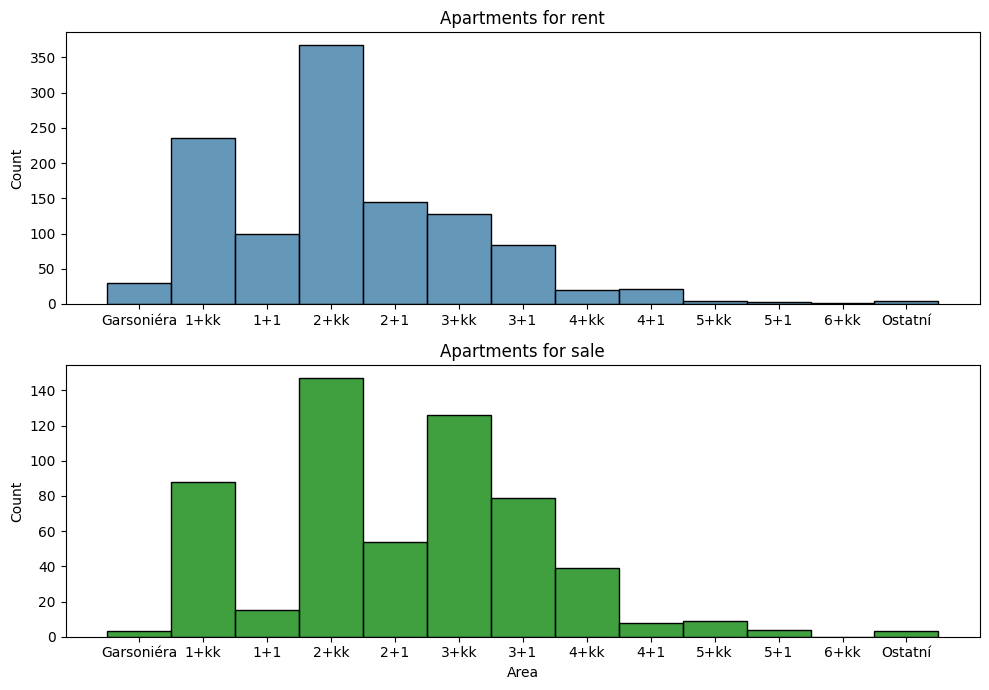
The same information displayed in a different way shows us that the difference is caused mainly by the 1+1 and 3+kk layouts:
If we take a look at the data in terms of Prague districts, we see a completely different picture than in the rental offer. The "winner" is Liboc, but upon closer inspection we find that this data is significantly distorted by the offer of five apartments in a kind of new building called Rezidence Liboc. Given that this is a small district, most of whose area is occupied by the parks Divoká Šárka and Hvězda, this is a big error of small numbers right here.
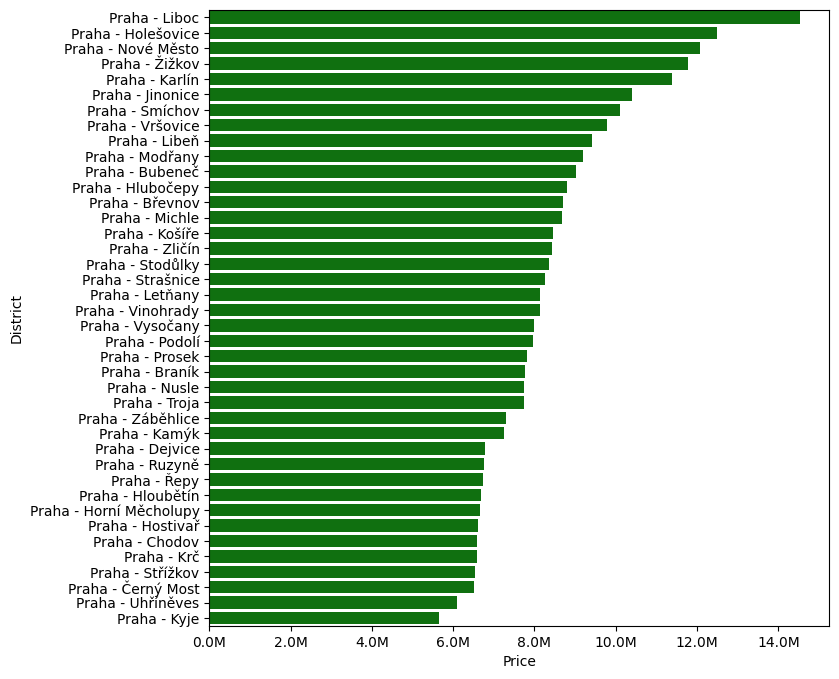
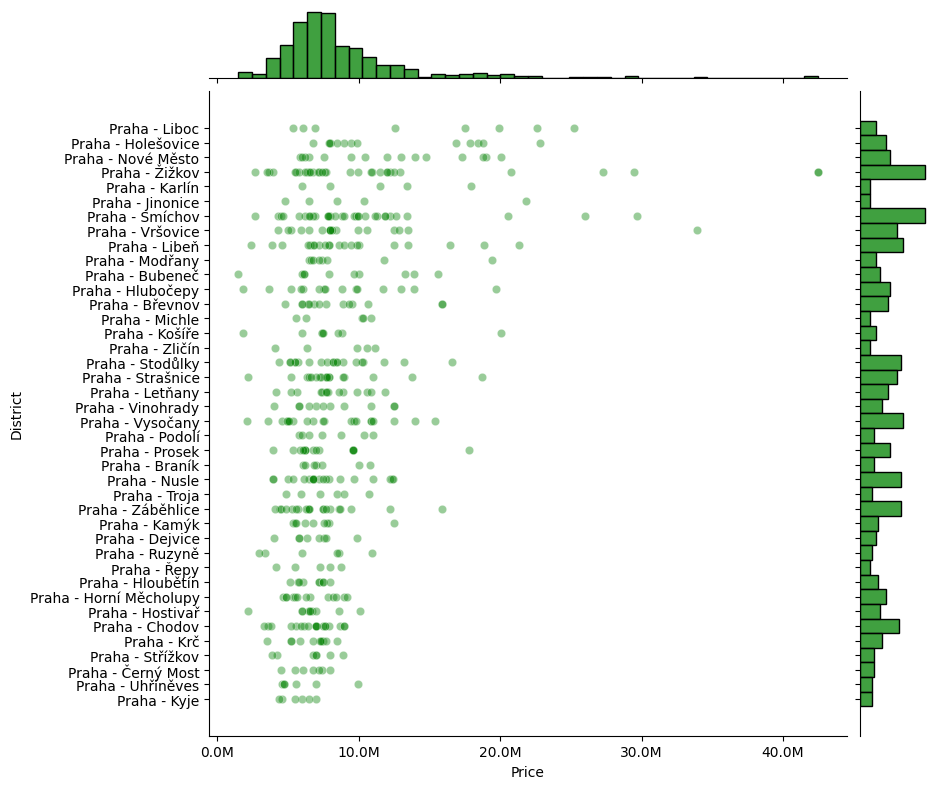
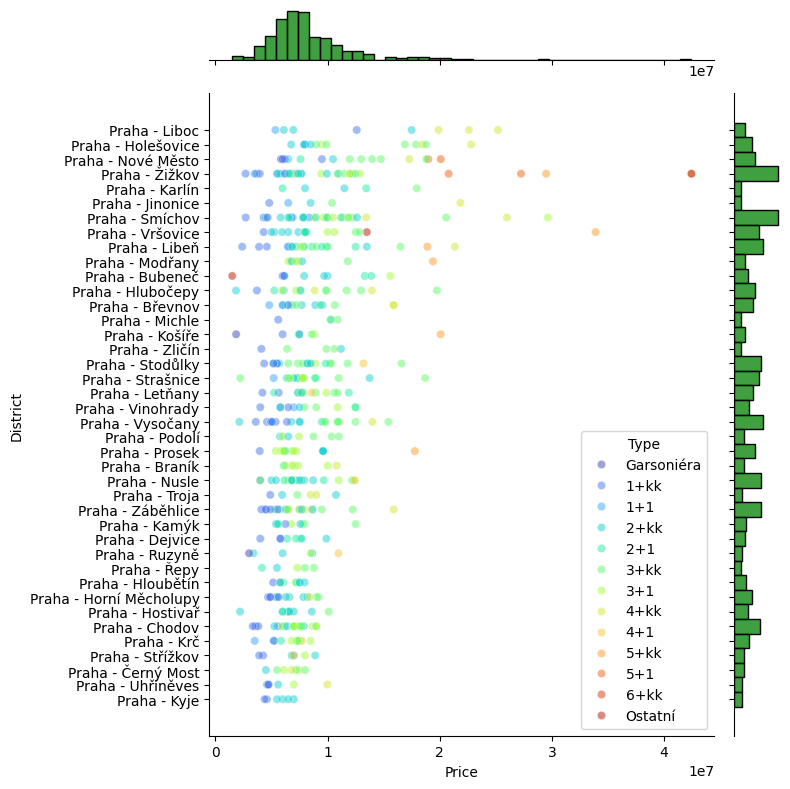
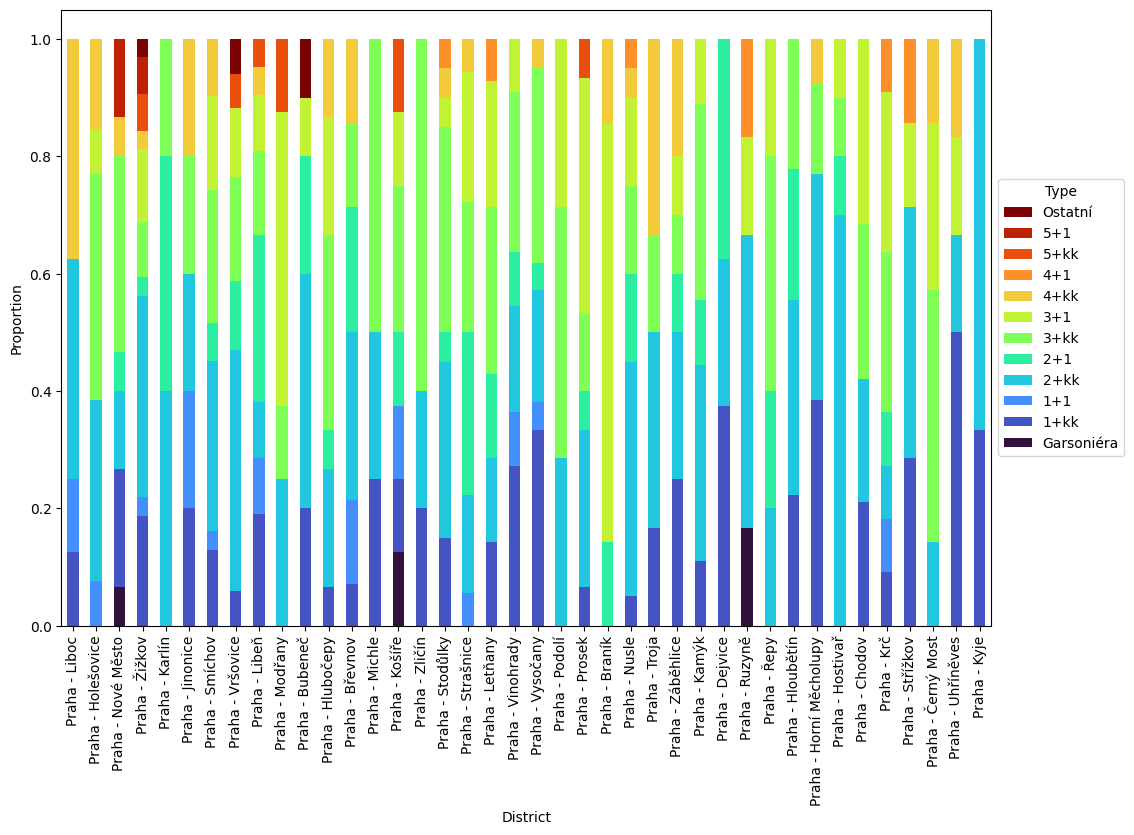
On the other hand, the price offers are the clear winner of Kyje. Here too, it is relatively easy to find an explanation. If we apply the same procedure to the analysis of the layout offer as for the rental offer, we see at first glance that on the day we scraped the data, there were only small apartments on offer in Kyje:
Note: this was made in the summer of 2024. Yeah the prices are different now.